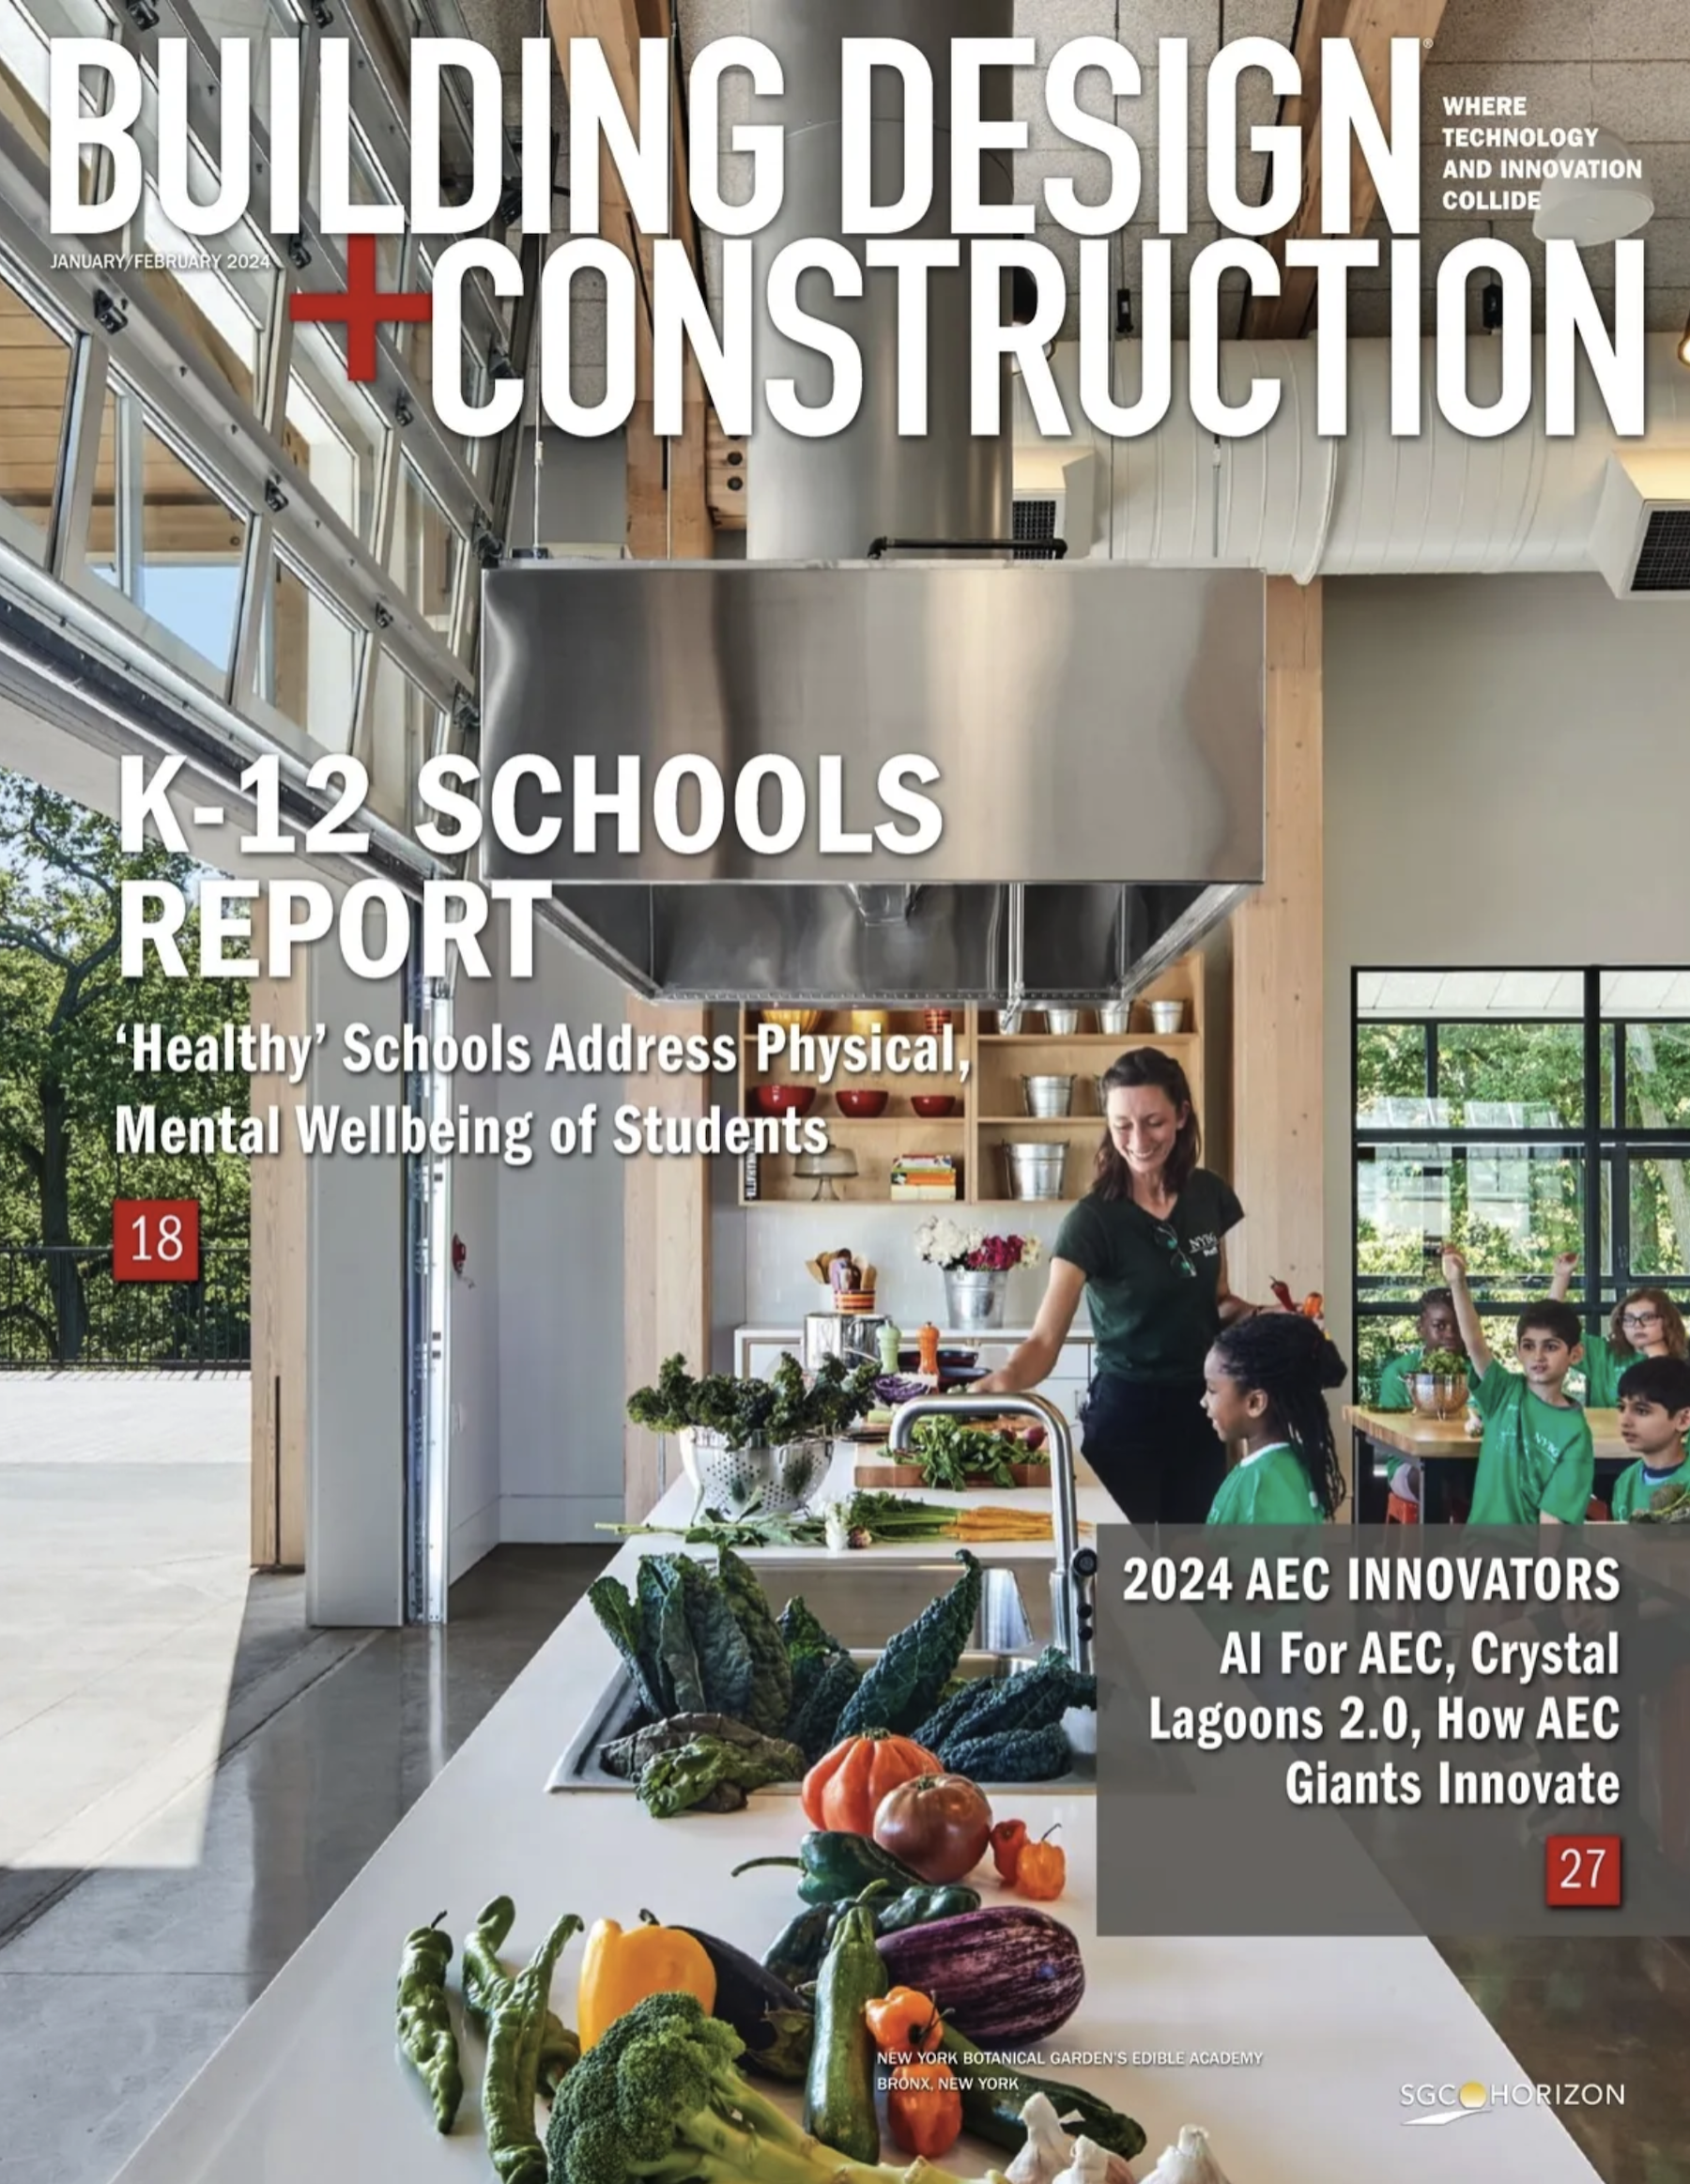
Educational facilities management leaders juggle a number of priorities including program consistency, health and safety, accessing funding and environmental responsibility. These leaders' number one priority is the education of our nation’s most valuable and vulnerable asset: the children.
The condition of educational facilities is proven to have a statistically significant impact on student behavior and achievement. Improvements to temperature control, air quality, lighting, acoustics and classroom space can benefit the morale and performance of staff and students. Many school systems across the country are looking to recover from the disruptions and learning loss in the aftermath of the COVID-19 pandemic by utilizing federal funding to improve facilities and safety.
As North America’s leading construction cost database, Gordian’s RSMeans Data has been synonymous with reliability since the 1940s, serving as a trustworthy resource when budgeting for projects. With localized square foot costs on over 100 building models, Gordian’s RSMeans Data allows architects, engineers and other preconstruction professionals to quickly and accurately create conceptual estimates for future builds.
This table shows the most recent costs per square foot for different levels of school buildings (elementary, junior high, high school, and vocational) in select cities, with sustainable, “green” building considerations.
New York City is the most costly metro market for K-12 school construction, with elementary school buildings running $320.96 per square foot on average and high schools at $319.16 per square foot. Honolulu, Chicago, Los Angeles, and Las Vegas round out the top five most-costly school construction markets analyzed by Gordian.
The national average cost for the four primary K-12 school buildings are: $239.21 for elementary schools, $230.36 for junior high schools, $233.16 for high schools, and $221.39 vocational schools.
Visit rsmeans.com/bdandc for more information about Gordian’s RSMeans Data.
Cost Per Square Foot for School Buildings With Green Building Considerations | ||||
City | Elementary | Junior High | High School | Vocational |
| National Average | $239.21 | $230.36 | $233.16 | $221.39 |
| Houston | $197.83 | $190.44 | $190.68 | $181.85 |
| Miami | $202.37 | $195.81 | $196.98 | $187.87 |
| Memphis, Tenn. | $208.43 | $198.35 | $198.62 | $189.38 |
| Denver | $213.18 | $205.35 | $206.78 | $196.82 |
| Baltimore, Md. | $222.75 | $214.14 | $215.80 | $206.00 |
| Las Vegas | $253.94 | $247.12 | $250.85 | $238.14 |
| Los Angeles | $277.00 | $267.90 | $272.84 | $258.68 |
| Honolulu | $287.16 | $284.99 | $288.29 | $274.88 |
| Chicago | $291.00 | $281.89 | $288.59 | $271.72 |
| New York | $320.96 | $311.08 | $319.16 | $301.24 |
Please note: Square foot models are used for planning and budgeting and are not meant for detailed estimates.
More building construction cost reports from Gordian:
Related Stories
Construction Costs | Feb 27, 2024
Experts see construction material prices stabilizing in 2024
Gordian’s Q1 2024 Quarterly Construction Cost Insights Report brings good news: Although there are some materials whose prices have continued to show volatility, costs at a macro level are returning to a level of stability, suggesting predictable historical price escalation factors.
Market Data | Feb 7, 2024
New download: BD+C's February 2024 Market Intelligence Report
Building Design+Construction's monthly Market Intelligence Report offers a snapshot of the health of the U.S. building construction industry, including the commercial, multifamily, institutional, and industrial building sectors. This report tracks the latest metrics related to construction spending, demand for design services, contractor backlogs, and material price trends.
Construction Costs | Jan 22, 2024
Construction material prices continue to normalize despite ongoing challenges
Gordian’s most recent Quarterly Construction Cost Insights Report for Q4 2023 describes an industry still attempting to recover from the impact of COVID. This was complicated by inflation, weather, and geopolitical factors that resulted in widespread pricing adjustments throughout the construction materials industries.
Construction Costs | Nov 15, 2023
Construction input prices decrease 1.2% in October, driven by lower energy, lumber, and steel prices
Construction input prices declined 1.2% in October on a monthly basis, according to an Associated Builders and Contractors analysis of U.S. Bureau of Labor Statistics’ Producer Price Index data released today. Nonresidential construction input prices fell 1.1% for the month.
Contractors | Nov 1, 2023
Nonresidential construction spending increases for the 16th straight month, in September 2023
National nonresidential construction spending increased 0.3% in September, according to an Associated Builders and Contractors analysis of data published today by the U.S. Census Bureau. On a seasonally adjusted annualized basis, nonresidential spending totaled $1.1 trillion.
Construction Costs | Sep 28, 2023
U.S. construction market moves toward building material price stabilization
The newly released Quarterly Construction Cost Insights Report for Q3 2023 from Gordian reveals material costs remain high compared to prior years, but there is a move towards price stabilization for building and construction materials after years of significant fluctuations. In this report, top industry experts from Gordian, as well as from Gilbane, McCarthy Building Companies, and DPR Construction weigh in on the overall trends seen for construction material costs, and offer innovative solutions to navigate this terrain.
Building Owners | Aug 23, 2023
Charles Pankow Foundation releases free project delivery selection tool for building owners, developers, and project teams
Building owners and project teams can use the new Building Owner Assessment Tool (BOAT) to better understand how an owner's decision-making profile impacts outcomes for different project delivery methods.
Hotel Facilities | Jul 26, 2023
Hospitality building construction costs for 2023
Data from Gordian breaks down the average cost per square foot for 15-story hotels, restaurants, fast food restaurants, and movie theaters across 10 U.S. cities: Boston, Chicago, Las Vegas, Los Angeles, Miami, New Orleans, New York, Phoenix, Seattle, and Washington, D.C.
Healthcare Facilities | Apr 13, 2023
Healthcare construction costs for 2023
Data from Gordian breaks down the average cost per square foot for a three-story hospital across 10 U.S. cities.
Higher Education | Apr 13, 2023
Higher education construction costs for 2023
Fresh data from Gordian breaks down the average cost per square foot for a two-story college classroom building across 10 U.S. cities.


90d8.png)
